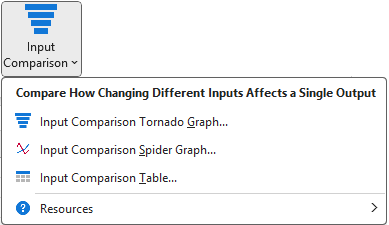
An input comparison analysis is used to analyze the relative impact of multiple inputs on a single output.
See the article Sensitivity Analysis Overview for more information about how Sensitivity Explorer analyses work, in general.
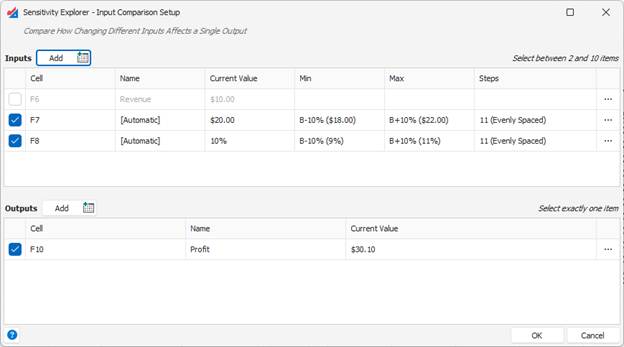
Choose Inputs and Outputs
Start by selecting multiple inputs (a maximum of ten) and a single output from your workbook model. If you have previously used this workbook with Sensitivity Explorer, your inputs and outputs may already be shown in the lists. If they are not yet there, click the input or output “Add” button to add the cells. (See the article Working with Inputs and Outputs for more information.)
Run the Analysis
When you click the OK button, Sensitivity Explorer varies, in turn, each input you selected across the range of values specified for it. For each value, Excel recalculates your spreadsheet and records the output value.
Analyze the Results
After the analysis is complete, a result window is displayed. Input Comparison analysis results include three result views: Tornado Graph View, Spider Graph View, and Table View. These are simply three ways of presenting the same underlying set of results. The initial view displayed will depend on the menu item you chose from the ribbon when starting the analysis, but you can change the view by clicking the view buttons at the bottom of the window.
For more information about all the options in this window please see the article Working with Result Windows.
Tornado Graph View
The tornado graph view succinctly summarizes the relationship between the collection of inputs and the output. Each input is represented as a bar that spans across the range of output values it produced while it was being varied. The inputs are sorted so that the largest bars are always at the top of the graph, allowing you to quickly identify the key drivers of variation of the output.
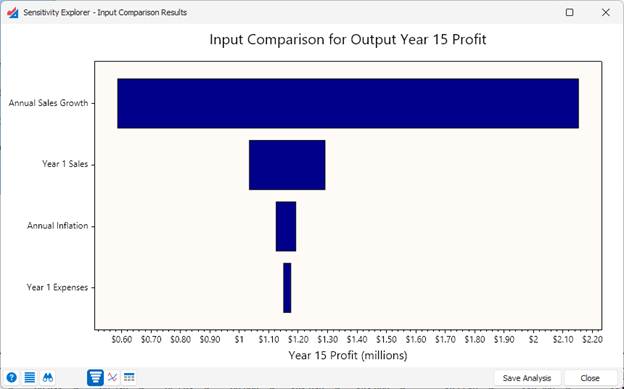
- This graph can be customized, copied to the clipboard, or exported to Excel by clicking the Actions icon at the bottom of the window.
- Clicking the Inspector icon at the bottom of the window will open a panel to the right of the graph where you can select and focus on more detailed information, including the identification of each calculated value performed during the analysis.
Spider Graph View
The spider graph view displays, in detail, how each input affects the output. Since the inputs, in general, will have different scales and units, they are plotted in terms of relative change from their base-values. This allows them to be plotted on a single graph, and for easy comparisons to be made between them.
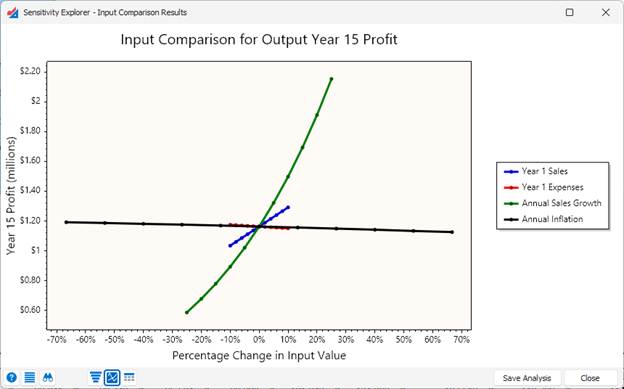
- This graph can be customized, copied to the clipboard, or exported to Excel by clicking the Actions icon at the bottom of the window.
- Clicking the Inspector icon at the bottom of the window will open a panel to the right of the graph where you can select and focus on more detailed information.
Table View
The table view shows all the input and output values in tabular format:
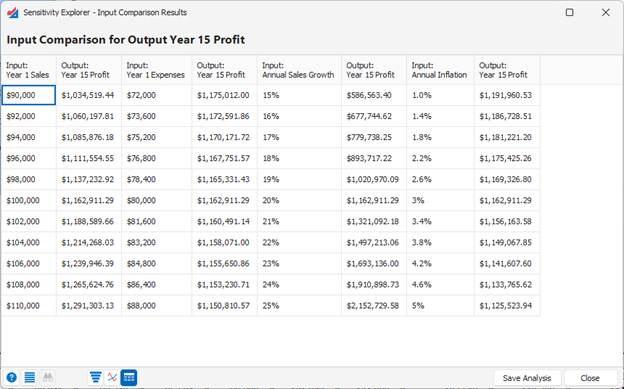
- The table can be customized, copied to the clipboard, or exported to Excel by clicking the Actions icon at the bottom of the window.
Was this article helpful?
That’s Great!
Thank you for your feedback
Sorry! We couldn't be helpful
Thank you for your feedback
Feedback sent
We appreciate your effort and will try to fix the article