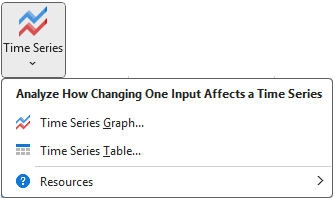
Time Series analysis lets you investigate how changes to an input affect a potentially large range of cells.
See the article Sensitivity Analysis Overview for more information about how Sensitivity Explorer analyses work, in general.
Choose an Input and Define a Time-Series
Start by selecting a single input. If you have previously used this workbook with Sensitivity Explorer, your input may already be shown in the list. If it is not yet there, click the Add button to add the cell. (See the article Working with Inputs and Outputs for more information.)
Next, define the time series’ Value Range. This is simply an Excel-range containing the cells to be analyzed. The values must be in a single contiguous row or column.
Optionally, you can also specify a Time-Series Name, a label that can be used for the time-series as a whole, and a Name Range, a group of cells that contain names for each position of the time-series.
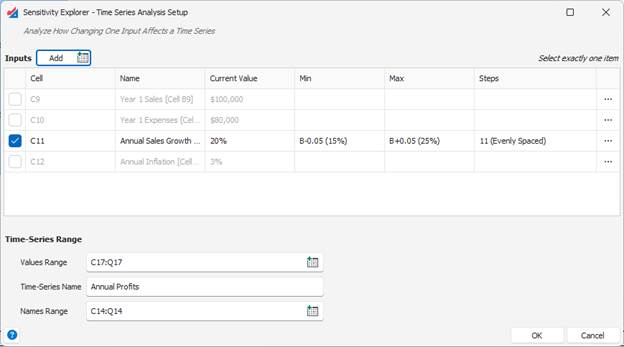
Run the Analysis
When you click the OK button, Sensitivity Explorer varies the input you selected across the range of values specified for it. For each value, Excel recalculates your spreadsheet and records the time-series cells.
Analyze the Results
After the analysis is complete, a result window is displayed. Time-Series analysis results include two result views: Time-Series Graph View, and Table View. These are simply two ways of presenting the same underlying set of results. The initial view displayed will depend on the menu item you chose from the ribbon when starting the analysis, but you can change the view by clicking the view buttons at the bottom of the window.
For more information about all the options in this window please see the article Working with Result Windows.
Time Series Graph View
The time series graph view displays a time series line for each of the input values. By default, the line corresponding to the base input value is black, that of the minimum input value is blue, and the maximum is red. The values in between are of graded shades.
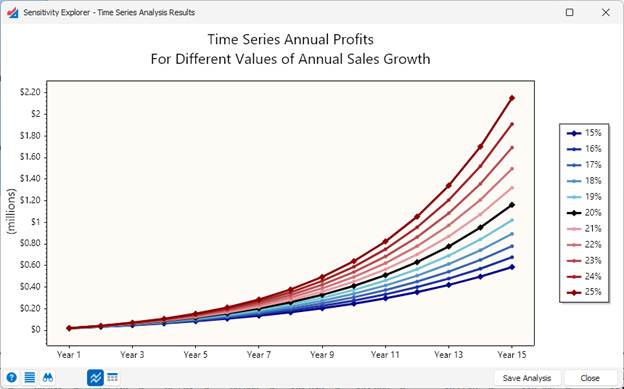
- This graph can be customized, copied to the clipboard, or exported to Excel by clicking the Actions icon at the bottom of the window.
- Clicking the Inspector icon at the bottom of the window will open a panel to the right of the graph where you can select and focus in on more detailed information about each point.
Table View
The table view shows all the input and output values in tabular format:
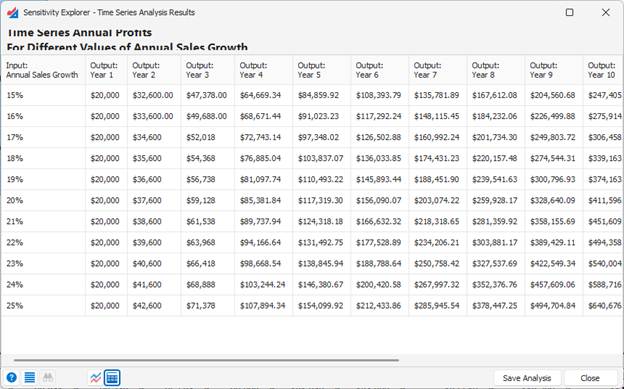
- The table can be customized, copied to the clipboard, or exported to Excel by clicking the Actions icon at the bottom of the window.
Was this article helpful?
That’s Great!
Thank you for your feedback
Sorry! We couldn't be helpful
Thank you for your feedback
Feedback sent
We appreciate your effort and will try to fix the article